
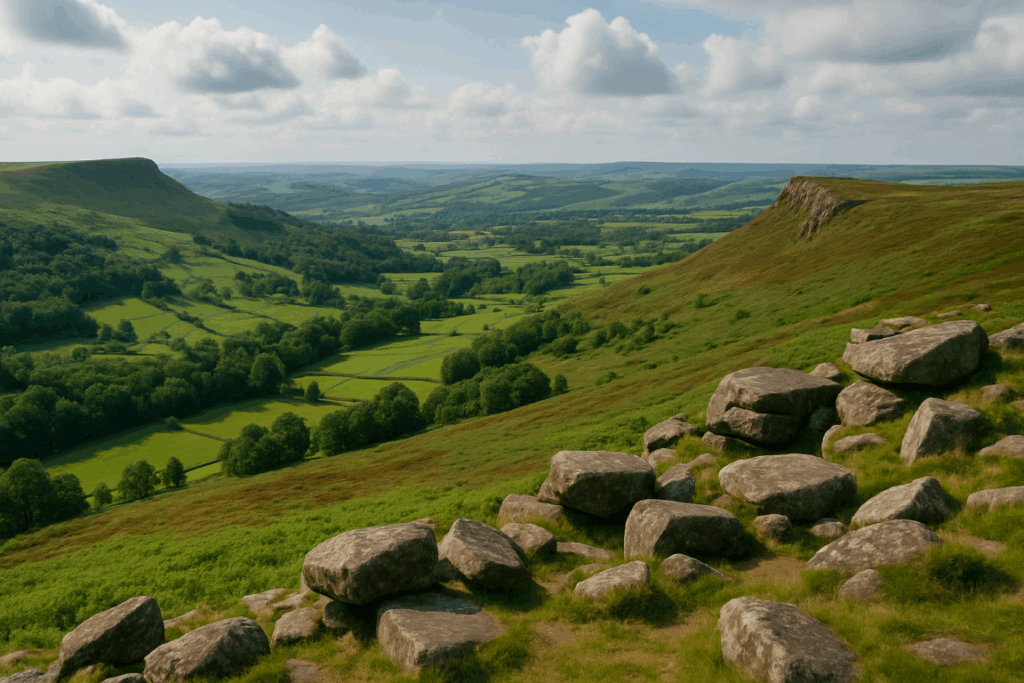
Reading contour lines is one of those skills that looks straightforward on a classroom table and turns treacherous the moment you’re standing on a mist-soaked hillside in the Lake District wondering which of the two spurs dropping away beneath you is the one you want. I’ve been there more times than I’d like to admit. The map says one thing. The ground says something altogether different.
The gap between understanding contour lines in theory and using them under real mountain conditions is wider than most walkers expect. This guide is about closing that gap, with practical examples from the kind of terrain you’ll actually encounter on British hills: slabby Welsh ridges, boggy Pennine plateaux, craggy Highland escarpments, and the thoroughly confusing groundscape of places like the Cairngorms when the cloud base sits at 700 metres and you can barely see your next footstep.
What contour lines are really telling you
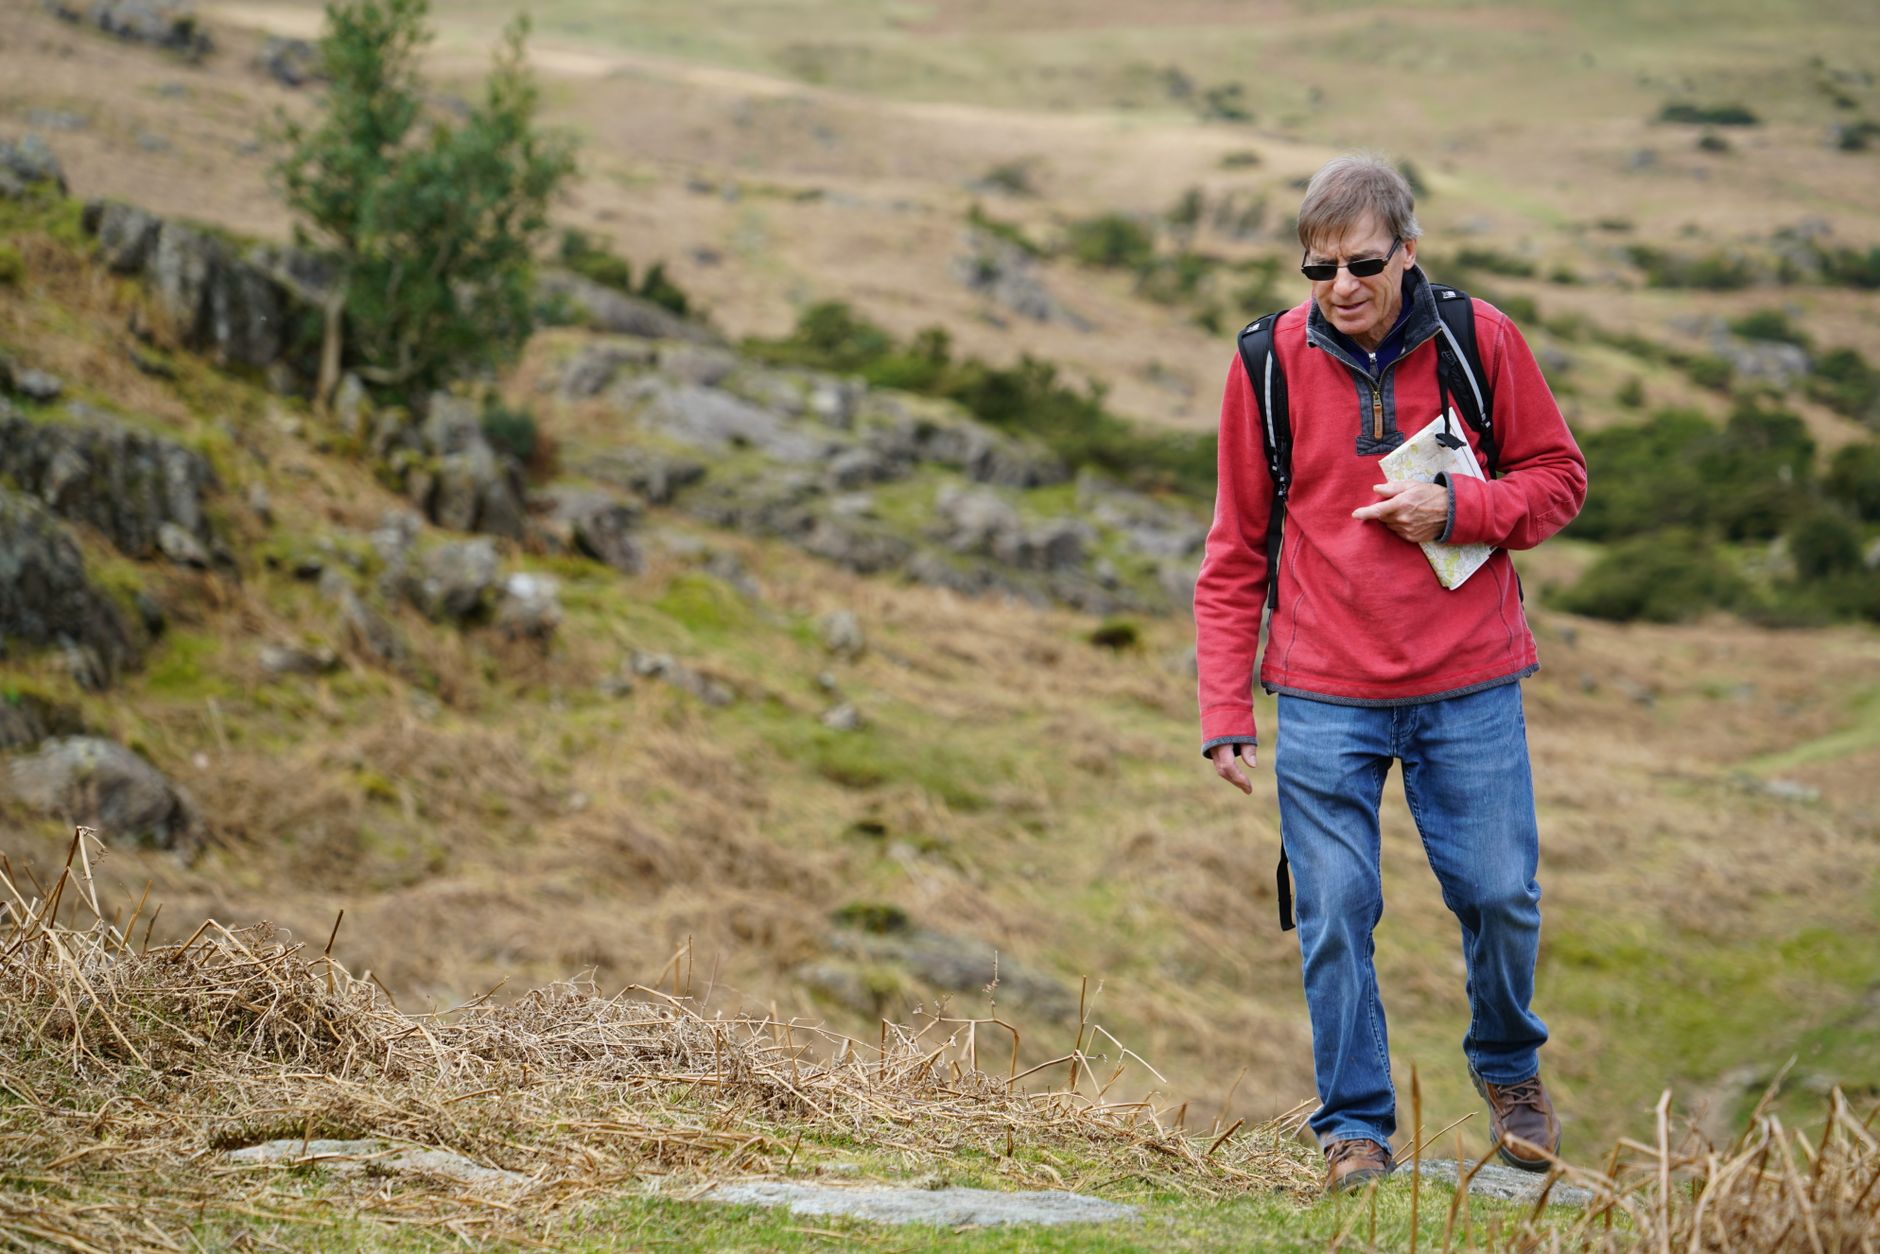
Every contour line on an Ordnance Survey map joins points of equal height. On a 1:25,000 map, each line represents a 10-metre interval. On a 1:50,000, it’s usually still 10 metres per contour but the lines are spaced further apart visually, which makes gradients harder to judge at a glance.
The first thing to burn into your brain: tightly packed lines mean steep ground, widely spaced lines mean gentle ground. That part most people get. The part they miss is that contours can’t show you everything. A vertical crag, by definition, has zero horizontal distance between its top and base. On the map, those contour lines don’t just crowd together, they can actually merge or, on a 1:50,000, disappear entirely into what looks like a thickened line. If you see contours virtually touching and then nothing for a space before the next set, suspect a cliff. A thick brown smear on a 1:50,000 is a crag. Treat it as such.
Judging gradient before you commit to a line
On a 1:25,000 map, the golden rule I use: if the contours are closer together than about 2mm, you’re looking at ground steeper than roughly 45 degrees. At that kind of gradient on wet grass or heather, a slip without an ice axe can go badly wrong. More than 3mm apart and you’re probably walking on something you can stroll without poles.
Count the contour lines between two points and multiply by 10. That’s your ascent in metres. Then measure the horizontal distance using the map scale. Divide the height by the horizontal distance and you’ve got the gradient ratio. It sounds laborious but after a few dozen hills you do it instinctively. I now glance at a section of map and have a reasonable feel for whether it’s a gentle ridge or something that’ll make my calves ache for three days.
The classic mistake is underestimating how much contour lines can compress a feature. A coire wall in Snowdonia might look like a moderate slope on the map but pack in enough lines and you’re suddenly scrambling. If you want to understand what the map is really showing before committing to a route in complex terrain, cross-referencing with reliable weather and visibility data helps enormously. The article on how to read a UK mountain weather forecast is worth bookmarking alongside your map skills, because the two go hand in hand.
Spotting cols, ridges, and re-entrants
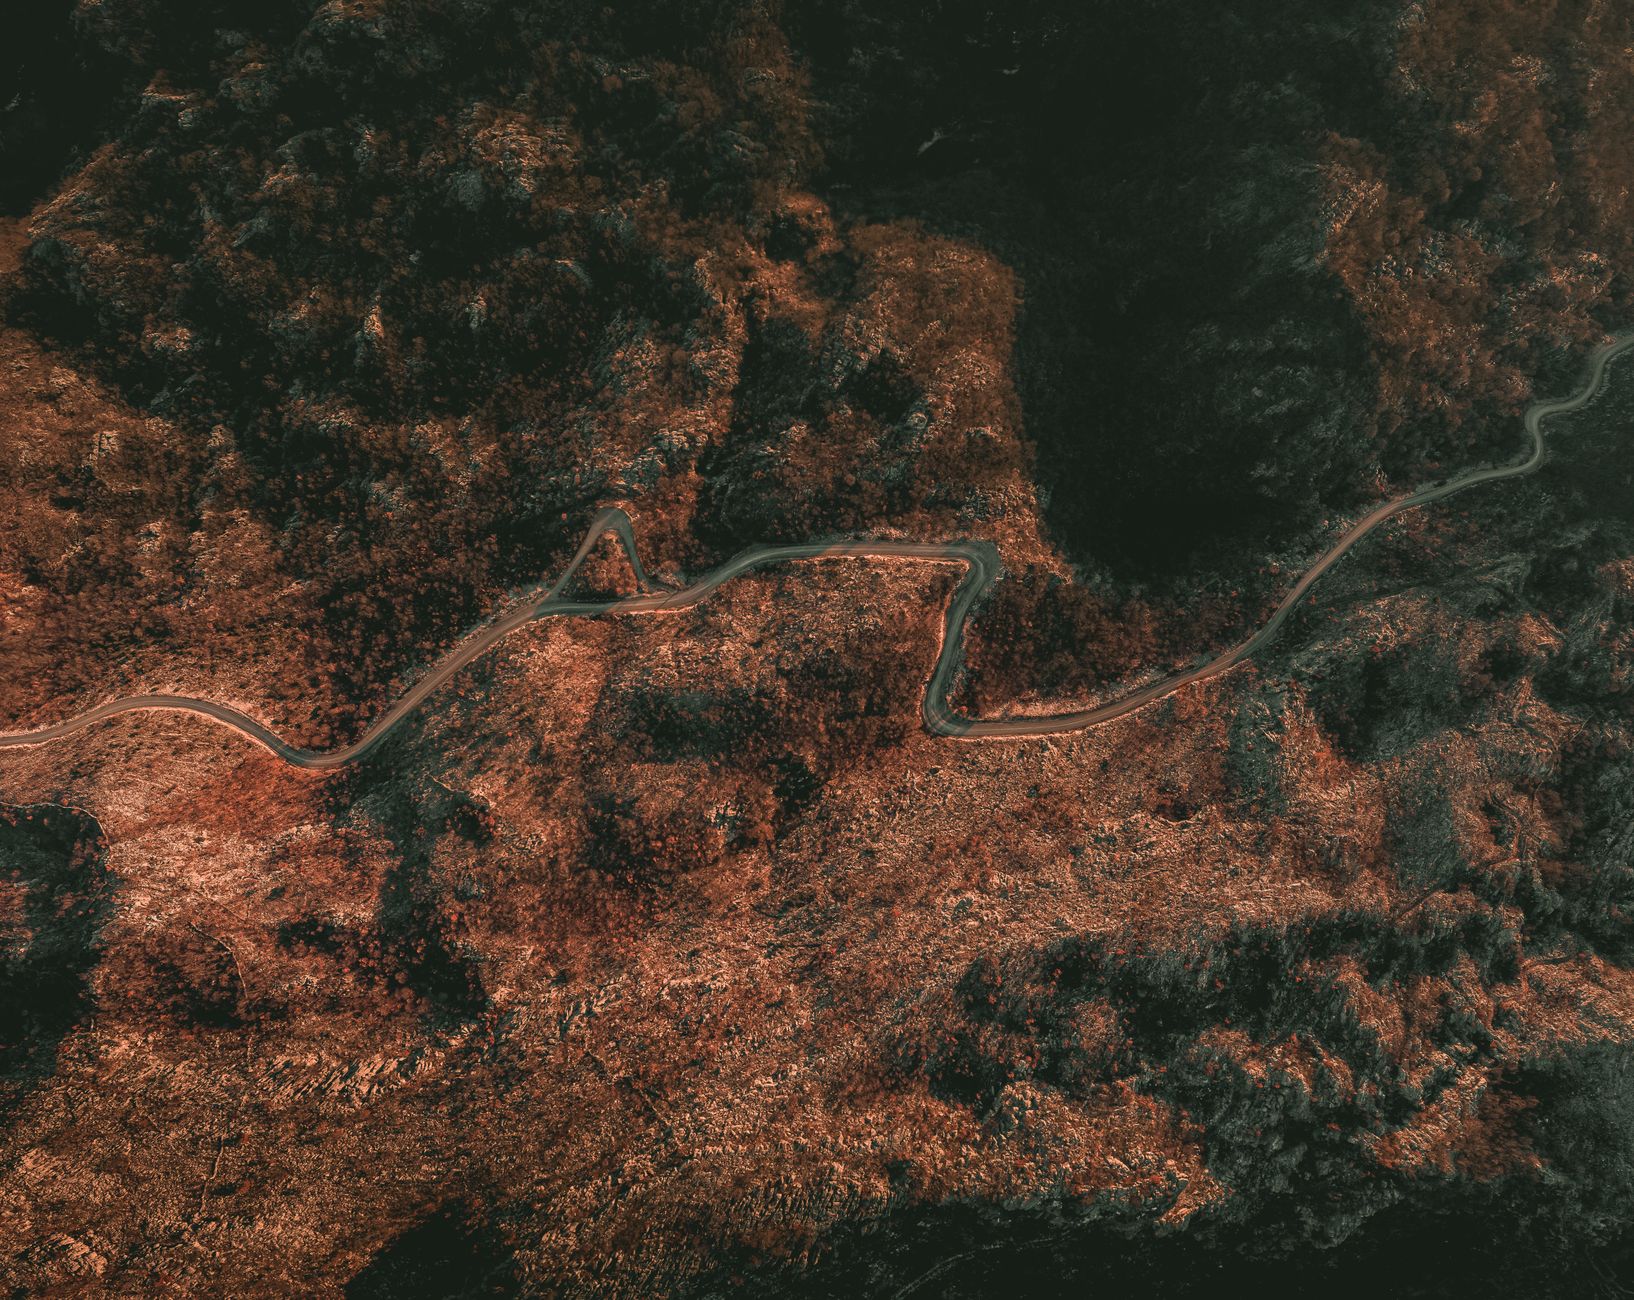
A col (or saddle) is where a ridge dips between two higher points. On a map, it looks like two sets of contours curving towards each other from opposite directions, with the contours of the two summit areas either side. Cols are often the key navigation waypoints on a ridge walk, they’re the moments where you cross from one drainage system to another, and spotting them accurately on a map before you set off keeps you from wandering onto the wrong spur when the mist comes in.
Re-entrants are the V-shaped indentations where a valley cuts into a hillside. They show as V-shapes on the map pointing uphill. These matter more than people realise because on a wide featureless slope, the kind you get across the Carneddau in Wales or on the upper Cheviot plateau, re-entrants are often the only relief features you can actually locate on the ground. I’ve used tiny re-entrants on the Brecon Beacons, barely three metres deep, as confident navigation checkpoints in zero visibility. If you’re planning winter outings in that area, the Brecon Beacons winter walking guide covers the specific ridge complexities in much more detail.
Spurs are the opposite: the noses of ground that stick out from a hillside, showing as contour lines that bend downhill. Confusing a spur with a re-entrant in poor visibility is one of the most common navigational errors I see on mountain safety call-outs. On the map, both create V-shapes, the difference is which way the V points relative to the uphill direction.
When visibility drops: using contours as your compass
This is where reading contour lines goes from a pleasant map-reading exercise to a survival skill. In clag, you can’t see landmarks. Your GPS can drift or run flat. What you have, always, is the shape of the ground beneath your feet, and that shape is exactly what the map’s contours are recording.
The technique I rely on is what I’d call gradient awareness navigation. Before visibility drops, study the terrain profile you expect to cross. Memorise the sequence: sharp ascent, flattening onto a plateau, the slight leftward drift of the ridge as you drop to the col, then a steeper descent on the far side. When you can’t see ten metres ahead, you navigate by feeling the ground angle change beneath your boots. If you expected the slope to ease and it’s getting steeper, something is wrong, you’ve drifted off the intended line.
Timing helps here. At a normal hillwalking pace of about 4 kilometres per hour on reasonable ground, you cover roughly 65 metres per minute. Time yourself between features on the map. If the contours say you should reach a flattening in 400 metres and six minutes have passed without it, stop and recheck your bearing.
Boggy ground, which is common enough across Scottish and Northern English moorland, can distort your perception of slope. Peat hags and tussock grass force detours that eat into your estimated distances. I’ve written previously about the strangely absorbing world of walking UK peat bogs, but from a navigation standpoint, just know that the ground rarely goes in a straight line when it’s waterlogged, and your dead reckoning needs to account for that.
Practical habits that sharpen your contour reading
Three things I do on every hill day, regardless of how familiar the route is.
First: I trace the contour line at my destination’s height across the map before I leave. This tells me what the landscape at that altitude looks like, whether I’m heading onto a broad plateau, a narrow arête, or a complex series of bumps and hollows. Mountain Rescue teams across Britain report that a large proportion of callouts involve walkers who were navigating to a summit but didn’t study the shape of the terrain leading up to it. The official government guidance on mountain safety is clear that map competence, not just GPS reliance, remains the core skill.
Second: I count contour crossings on descent as well as ascent. People focus on the uphill but the downhill is where navigation errors become emergencies. If you expected to cross five contours on the way down to a stream and you’ve crossed three but the stream isn’t there, you’ve either drifted or the stream has dried. Both matter.
Third: I deliberately practise on terrain I already know well. Going back to a familiar hill in poor visibility and navigating purely by map and compass (with GPS as a safety net, not a crutch) builds the muscle memory faster than anything else. It sounds obvious but most walkers only practise navigation when they feel lost, which is exactly the worst moment to be learning.
One final thought. I recently had a conversation with someone who works in property surveying and mentioned how much of their day involves reading technical documents, floor plans, energy assessments from places like r2g.co.uk, land registry maps, and translating flat diagrams into three-dimensional reality. It’s a different world from hillwalking but the cognitive process is surprisingly similar: you’re always bridging between the abstraction on paper and the actual thing in front of you. That skill is worth practising wherever you can.
The map is a compression of the world. Contour lines are its grammar. Learn to read them fluently and the mountain stops being a place where you get lost. It becomes a place you can move through with something close to confidence, even when the cloud rolls in and the ground goes sideways.
Frequently Asked Questions
What is the contour interval on an Ordnance Survey map?
On both the 1:25,000 (Explorer) and 1:50,000 (Landranger) OS maps, contour lines are drawn at 10-metre vertical intervals. Every fifth line is an index contour, drawn slightly thicker, to make counting easier.
How do I tell a valley from a ridge when reading contour lines?
Both features create V-shapes on a map. The key is which way the V points relative to higher ground. A valley (re-entrant) shows V-shapes pointing uphill; a ridge (spur) shows V-shapes pointing downhill. Checking which side the higher contour numbers fall on confirms which you’re looking at.
How can I judge how steep a slope is from a contour map?
On a 1:25,000 OS map, contour lines closer than about 2mm apart represent ground steeper than roughly 45 degrees, which is serious terrain on wet grass. Count the lines between two points, multiply by 10 for the height gain in metres, then divide by the horizontal map distance scaled up to real distance to get the gradient ratio.
Why does the ground never look exactly like the contour map?
Contour lines smooth out small features: individual boulders, narrow gullies, shallow peat hags, and short-lived streams don’t appear. The map is a 10-metre vertical resolution model of the land, so detail finer than that interval is invisible. Experience on real terrain helps you mentally fill in those gaps.
What should I do if I lose my bearings in low visibility on a British mountain?
Stop, resist the urge to keep moving, and work back from your last confirmed position on the map. Use gradient awareness, the angle of the ground beneath you, to cross-check the map’s contour pattern. If you have a compass bearing for your destination and can estimate the distance remaining, a careful bearing walk in timed legs is safer than guessing. If genuinely unsure of your safety, call 999 and ask for Mountain Rescue.